
Forest Information System
by admin
Overview of Forest Resources in Zimbabwe
In Zimbabwe, forest resources are under constant pressure and are called upon to produce useful forest products, environmental services, wildlife habitat, recreation, and opportunities for livelihoods. Many of these demands conflict with one another – for example, the need to convert forested land to agricultural production in Zimbabwe due to the increasing demand for food and fuel is a threat to the use of natural forests as carbon sinks. Conflicting demands increase as the human population continues to grow, income levels and wood and food consumption rates increase at a time when the area of natural forest continues to decline.
Forestry Commission first produced a national land cover map in 1992, with technical and financial assistance from GIZ.The statistics for 1992 have been used for all international reporting e.g., FAO Forest Resource Assessment (FRA) and sustainable development goal number 15. The 1992 land cover maps were produced from interpretation of Landsat images of 30 metre resolution.
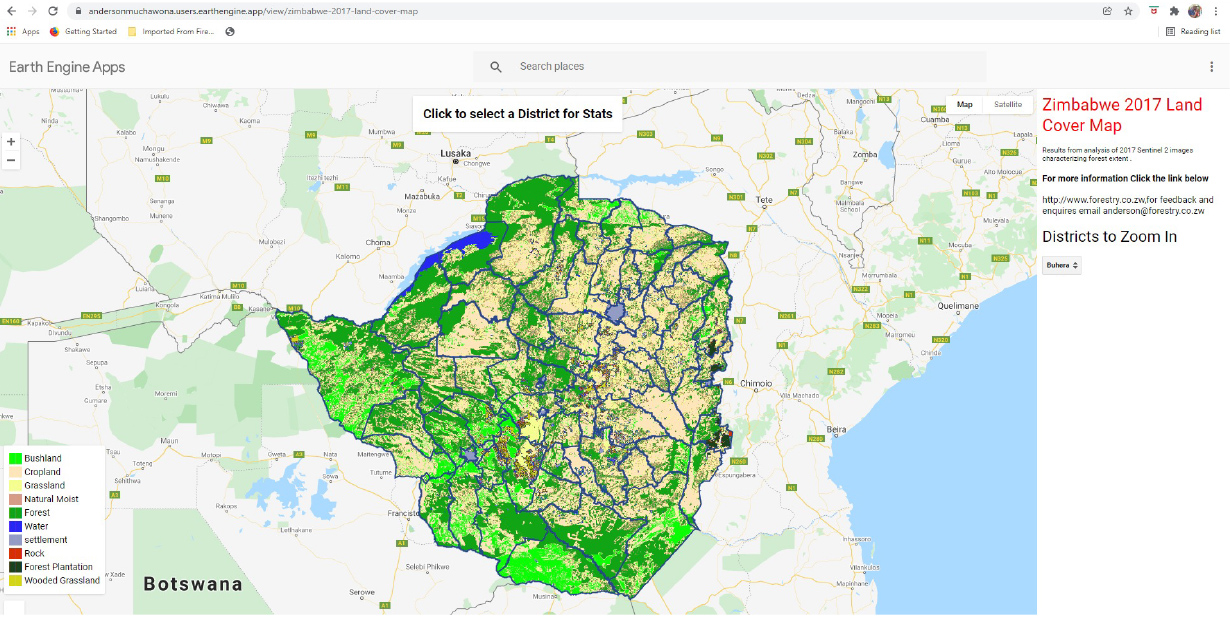
The 2017 land cover map was produced from the interpretation of sentinel 2 satellite images, processed using Google Earth Engine (GEE) platform. The map was produced with technical assistance from Food and Agriculture Organisation (FAO), Forest Resource Assessment team.
Land Cover Statistics are critical in policy formulation and decision making for sustainable management of natural resources. Therefore, there is needed to periodically produce exactly accurate information.
Deforestation is the conversion of forest to other land uses, such as agriculture and infrastructure. The difference between forest area net change and deforestation is that the former is the result of all losses and gains (natural expansion of forest as well as afforestation) and the latter considers only the area of forest that has been converted to other land uses (FAO ,2020).
The period 1992 to 2017 key findings:
The country has a total natural forest area of 18.351 million hectares, which is about 46 percent of the total land area. The area under forest plantation is estimated to be 187 531.42hectares, which is about 0.48 percent of the total land area.
The area of forest continues to decline, and the country lost approximately 6 558 724.54 hectares for the period 1992 to 2017.
The annual deforestation rate is estimated at 262 348.98 hectares per annum for the period 1992 to 2017.The deforestation was derived from simple subtraction of 1992and 2017 land covers maps
Class Area(Ha) % of land
Forest 18351530.53 46.98
Bushland 5499231.607 14.08
Cropland 11951833.94 30.6
Grassland 1507895.38 3.86
Natural Moist 11607.5066 0.03
Water 414775.0515 1.06
Settlement 255981.46 0.66
Rock Outcrop 129067.342 0.33
Forest Plantation 187531.42 0.48
Wooded grassland 754816.23 1.93
Total 39064270.46 100
Geospatial tools
Forestry Commission Mapping and Inventory Unit developed a digital platform that allows easy access to the map and statistics. The platform was developed for 2017 and 1992 land cover map, it allows the user to view, generate and download statistics. The data can be accessed at district level.
The land cover app is in the Google Earth Engine interface and the user can access freely. The app is supported by the computing power of Google. The platform makes it easy even for people without prior remote-sensing experience to access the map. The scope of the new sharing platform is not limited to forest assessments only. It serves other reporting needs as well, including its significant contribution to the NDCs, LEDS and to the forest related indicators of the Sustainable Development Goals (SDG).
Link to the 2017 land Cover Map
Link to the 1992 land Cover Map

Drivers of deforestation and degradation
The study on the drivers of deforestation and forest degradation in Zimbabwe was done under the Support towards implementation of Zimbabwe’s Nationally Determined Contributions to the Paris Agreement (STZ-NDC) project which was implemented by the government of Zimbabwe through the Ministry of Lands, Agriculture, Water, Climate and Rural Resettlement’s Climate Change Management Department and United Nations Development Program with financial support from the Russian Trust fund. The Forestry Commission researchers conducted a country wide survey that involves satellite data analysis and stakeholders consultations.
Deforestation and forest degradation hotspots were found to be common in all the provinces, mainly the rural, resettlement and peri-urban areas. The direct drivers of deforestation include Firewood, settlements, agriculture, wildfire, tobacco curing, charcoal, brick making, logging, overstocking, construction, mining and brushwood. The indirect drivers included socioeconomic factors, legal factors, tenure, climate change/environmental factors and politics. Settlement expansion, agriculture, mining and tobacco curing were the most common drivers of deforestation and forest degradation and the most difficult to address. Mining and agriculture are likely to remain important in the future because both are economic pillars of the country.
Permanent Sample Plots (PSPs)
Permanent Sample Plots (PSPs) provide a unique long-term re-measurement dataset that is used to develop growth-and-yield models that support timber supply analyses and sustainable forest management decisions. Forestry Commission established (PSPs) between 1994 and 1997 in Gazetted forests namely Gwaai, Ngamo, Fuller ,Kazuma ,Ungwe ,Mudzongwe and Gwampa Forests. The plots were measured every years, the latest measured was carried out in 2021.The data contribute a lot to sustainable management of gazetted forests in Zimbabwe.
In 2021 Forestry Commission with the help of FAO established new PSPs in Save valley conservancy, Mafungabutsi forest and Ruzawi in Marondera. Information and data from PSPs shall assist the organisation in monitoring forest resources in Zimbabwe.
Zimbabwe Biomass Map
The Mapping and Inventory unit in collaboration with the University of Edinburgh developed a biomass map using satellite data.

Work in Progress: 2020 land cover map
The 2020 Land cover map was developed from the interpretation and classification of 2020 Sentinel 2 satellite images. The images were processed and interpreted using Google Earth Engine which is a cloud computing system.
Validation Exercise
Field data is important for map validation .The ground truthing exercise was carried out between November and December 2021, covering the whole country. The Open Data Kit was used to collect field data .
To further improve the map more than 50 000 collect earth sample data were analysed and shall be used to improve the accuracy of the map.
Link to the collect earth project https://collect.earth/review-institution?institutionId=1720
Currently the accuracy assessment of the map is being carried out using collect earth sample plots and field data.
The final map is expected to be produced by the end of February 2022
Recommended Posts
THE NATIONAL FOREST POLICY
April 26, 2024
Carbon Trading in Zimbabwe
October 03, 2023
Tree of the Year 2023
September 27, 2023